



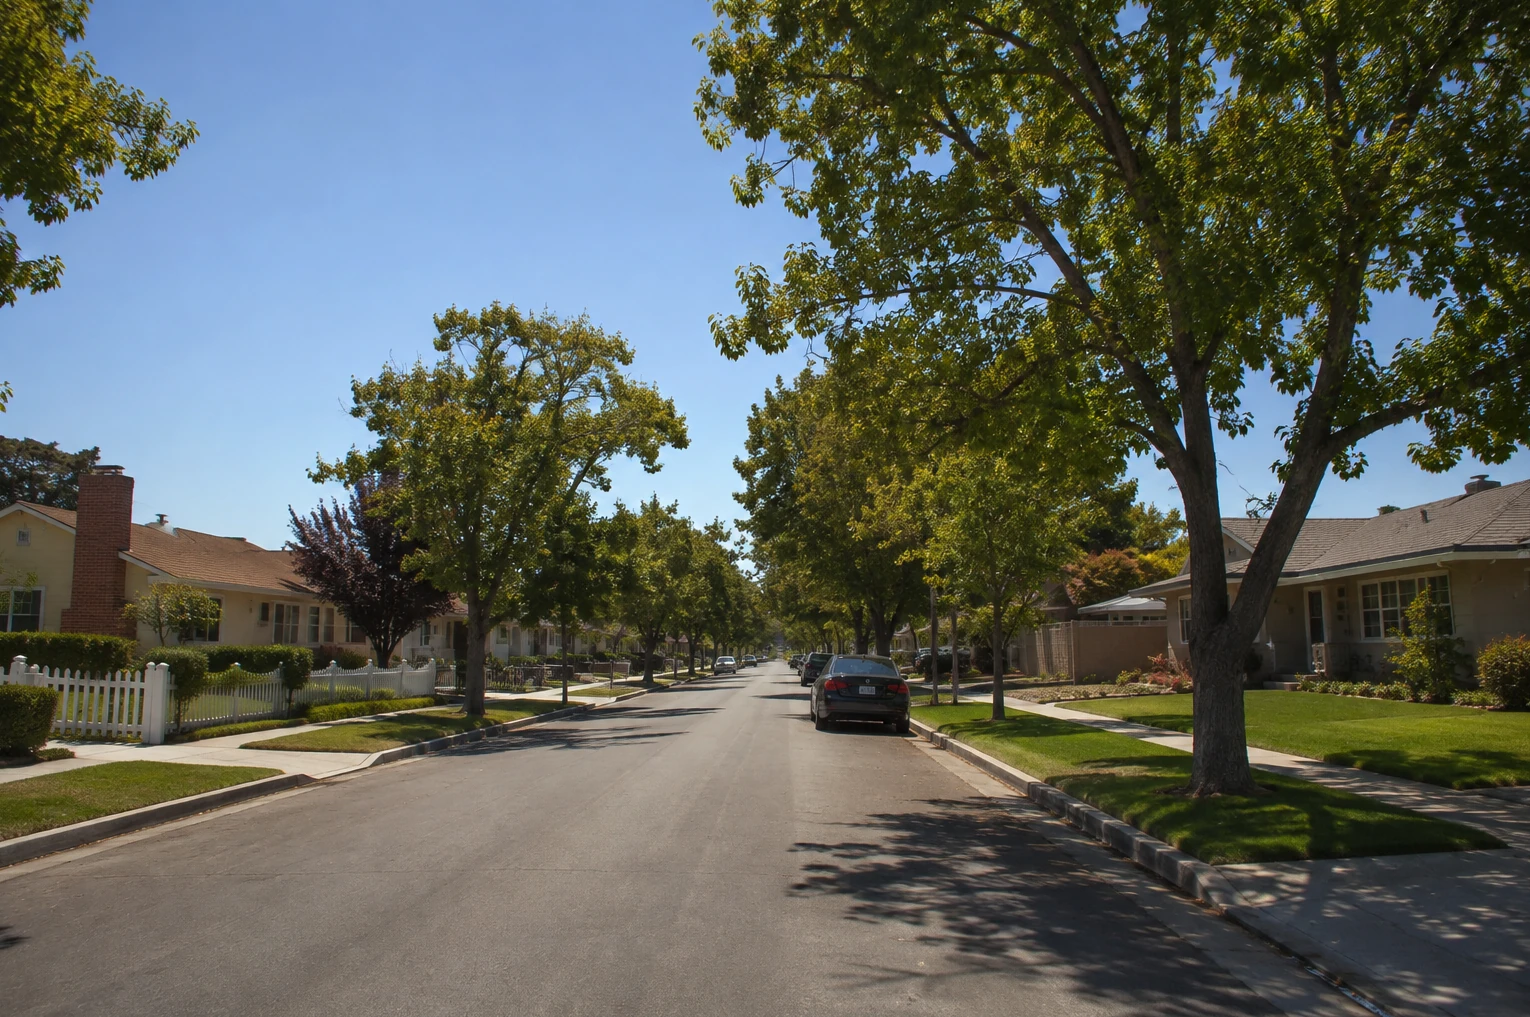
Anyone arriving from Brazil brings a question no listing answers: is this neighborhood safe? And they also bring a Brazilian way of answering it — looking for a high wall, bars, an electric gate, cameras. In the United States, that reading works in reverse, and whoever doesn't flip the switch reads everything wrong.
This piece explains the visual heuristic agents and residents use in California, why it usually works, and — just as important — where it fails and what to check in real data before deciding.
The inversion: here, a wall signals less, not more
In Brazil, a high wall and an electric fence signal a valuable property. In California, the logic flips: the most desirable areas tend to have an open lawn running to the sidewalk, a wide glass window and a door that opens straight onto the street. The absence of a barrier is a sign of confidence — and of status.
“When the houses have no walls, no bars, to me that's a very safe city. Who could sleep knowing your window is glass, your door is wood, one shove breaks it and someone's inside?” — Dina Silveira, in the episode
There's an institutional reinforcement to this: in many areas, the city itself limits what can be built at the front of the lot. Fence, wall and railing height are written into the municipal code, and changes require approval. Homeowners associations tend to be even more restrictive. In other words: in some neighborhoods, the absence of walls isn't only cultural — it's the rule.
What reading the street actually tells you
Signs that usually indicate an established neighborhood: well-kept lawns and maintained sidewalks; no bars on the windows; newer cars and no abandoned vehicles; mature trees — a sign of a street cared for over decades; working street lighting; and houses with signs of recent work, like a new roof or fresh paint.
Signs that call for attention: bars on windows and doors — the inversion of the local pattern; a high wall out front; properties with windows boarded up for a long time; trash or furniture piling up on the sidewalk; and an abrupt contrast between one side of the same street and the other, which usually marks a city line or an unincorporated area.
Where this reading fails — and it fails a lot
This is where most guides stop, and where the risk lives of making a decision worth hundreds of thousands of dollars based on a ten-minute impression.
Bars are also age, not only fear. In older neighborhoods, it's common to find homes owned by residents who have been there forty or fifty years, with bars installed in another era — often in the 1980s and 1990s, when the picture in the area was different. The bars stayed; reality changed. You're reading the past, not the present.
Aesthetics is not crime data. A pretty street and a safe street overlap often, but they're not the same thing. You may only be reading the neighborhood's median income. There are modest, very quiet areas, and expensive areas with specific problems — vehicle theft and package theft, for example, follow value, not poverty.
One visit is not a sample. A Tuesday afternoon doesn't show you the street on a Friday night, or on a stadium event day, or in the small hours.
The type of incident matters more than the volume. A neighborhood with many porch thefts and few violent crimes calls for one solution — a video doorbell and secure delivery — quite different from another with the opposite profile.
What to check in real data, not in impressions
The visual reading serves to generate a hypothesis. Confirmation comes from sources:
- The city police department's incident map — most cities in the region publish data by area and period. Look at the type of incident, not just the count.
- Visits at different times — at least one night and one weekend. If there's a stadium or major venue nearby, include a game day.
- Conversations with neighbors — the useful question isn't “is it safe here?” but “what has changed in the last five years, for better and for worse?”.
- Flight path and noise — near LAX, this varies street by street and doesn't show up in a photo.
- Administrative boundaries — confirm which city or unincorporated area the address sits in: policing, services and rules change at the line, even on the same street.
And there's the expectation yardstick that comes up in the episode: for someone coming from Brazil, the reference point for risk is different, and what gets called a “less quiet area” in the South Bay rarely matches what that phrase means back home. That helps calibrate — but it doesn't replace checking the data.
Sources and verification
- Incident data portals of municipal police departments across the South Bay region (searchable by area and period).
- California municipal codes on the height and placement of fences and walls in front setbacks; homeowners association (HOA) regulations.
- Best practices for evaluating a neighborhood: visiting at varied times and reading the type of incident, not only the volume.
Watch this part of the episode:
How to assess the safety of a neighborhood in California (approximate segment) — starting at 13:45 · CADÊ BRAZIL
This article is a reference edition of episode 16 of the podcast and is subject to edits and editorial additions. For the full conversation, watch the episode. — Updated on 14/08/2026.