



One number runs through the whole episode and is worth the entire conversation: over the past 40 years, the average price of homes in the United States has multiplied by roughly six times. Someone who paid US$100,000 in the mid-1980s now holds, on the national average, a property worth around US$600,000.
It is a true number and a dangerous one — because it says less than it seems. It is a national average, it is nominal (it does not discount inflation) and it describes the past, not a promise. This text opens the number up: where it comes from, how much of it is a real gain, why coastal California runs above the average, and what it legitimately allows you to conclude when deciding between renting and buying.
Where the six-times number comes from
The most widely used gauge of home prices in the United States is the FHFA House Price Index (HPI), from the federal agency that oversees Fannie Mae and Freddie Mac. It tracks repeat sales of the same property over time — that is how you compare apples to apples, instead of comparing the average 1986 home with today's, which is larger and better equipped. The series covers all 50 states and more than 400 cities and begins in the 1970s.
Multiplying by six over 40 years sounds explosive, but it works out to something around 4.5% a year, compounded. It is not a winning lottery ticket: it is a modest rate sustained for a very long time. What is impressive is not the speed — it is the persistence.
The years the chart went below zero
The reading that "almost every year closes positive" also holds, with one large exception and one small one. The large one is the housing crisis: between the first quarter of 2007 and the second quarter of 2011, the average price of American homes fell more than 20%, with the worst of it in late 2008. The small one is the early 1990s, when there was a mild pullback of less than one percentage point in some quarters.
It is worth noting the recent shape of the curve, because it is what confuses anyone looking at the chart today: after the pandemic jump, the American market did not start falling — it started rising slowly. FHFA quarterly reports from 2025 show annual appreciation around 2%, against double digits in 2021. Slowdown and decline are different things, and the year-over-year chart blends the two in the mind of anyone who does not know that the zero line is the divider.
Nominal is not real: where a third of the gain disappears
This is the adjustment that almost never travels with the number. Six times is the nominalprice. Over the same period, the American cost of living rose close to three times. Adjusted for inflation, that US$100,000 house did not become six houses of purchasing power: it became something around double.
Doubling your wealth over 40 years while living inside it is still a good result — and it is an honest sentence. "My property returned 500%" is not. Whoever buys imagining the first ends up satisfied; whoever buys imagining the second ends up disappointed even when everything goes right.
The California effect — and why the national average is not your house
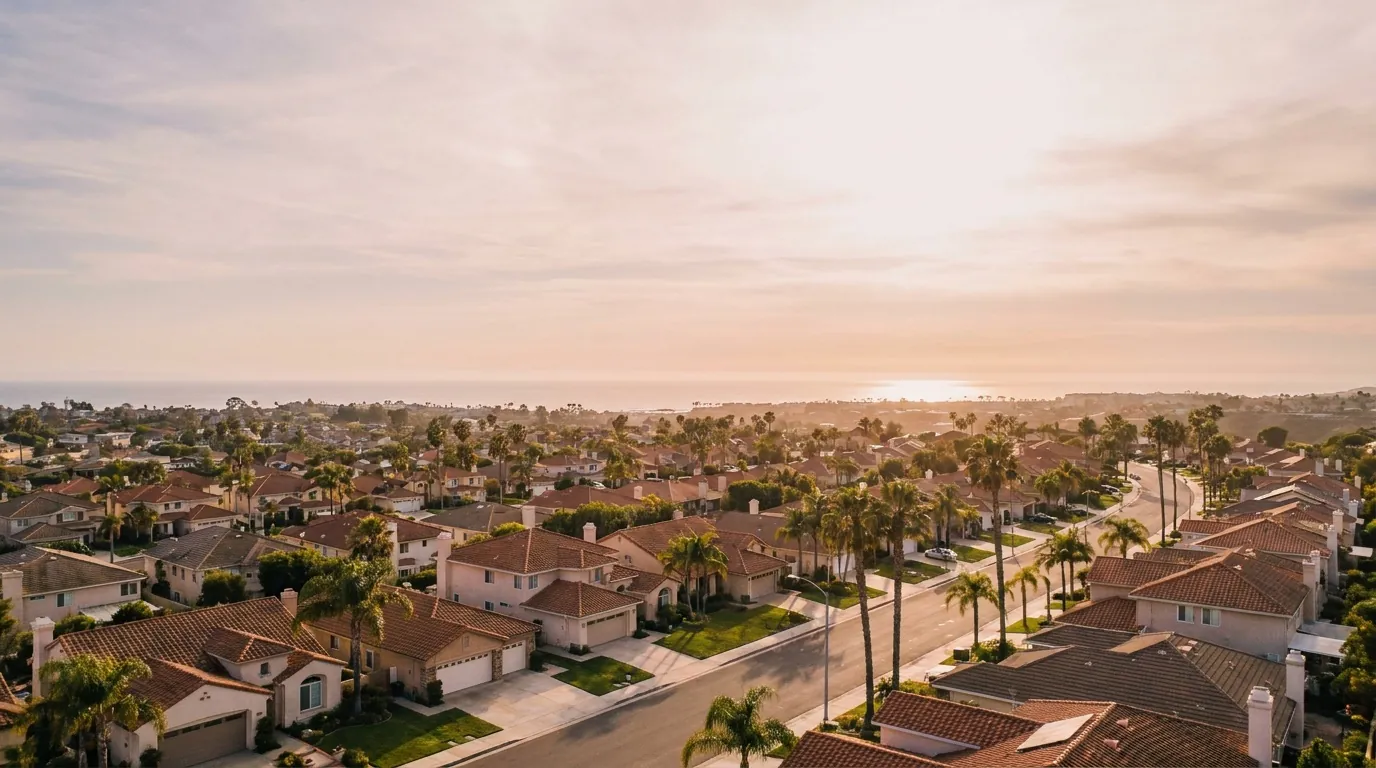
The chart discussed in the episode covers the entire United States. Coastal California runs outside it, almost always above. In Orange County, appreciation in 2025 was smaller than in previous years, but still positive — and the price level is another matter: the California Association of REALTORS® (C.A.R.) reported a median of around US$1.49 million for single-family homes in the county in June 2026, against roughly US$1.47 million a year earlier.
The reasons for that gap are structural, not market mood:
- Supply locked by geography and by law. The coastal strip is finite, and permitting in California is among the slowest and most expensive in the country — building new takes years.
- Demand driven by desire. Weather, beach, skilled jobs and schools pull people from across the country and abroad into the same handful of cities.
- Property tax locked in at purchase. Proposition 13 freezes the tax base at the acquisition value, with a capped annual adjustment. Whoever bought decades ago pays little to stay — and stays.
The flip side of that coin is risk: an expensive, concentrated market swings harder when local employment stumbles. A high average does not mean a wide safety margin.
What the number does not promise
The past is not a contract. Forty years of gains describe a period with two engines that may not repeat in the same dose: structurally falling interest rates since the 1980s and increasingly accessible mortgage credit.
Appreciation is not money in hand. While you live there, the gain is on paper. To turn it into cash you have to sell — and selling charges a toll: commission, transfer taxes, escrow, title and the move itself.
Owning costs money every month. Property tax in California runs around 1.1% of the purchase price per year, plus local assessments in some developments, insurance (which has risen sharply in the state), maintenance and, where applicable, HOA. None of that shows up on the appreciation chart.
The cycle is long. Anyone forced to sell between 2008 and 2011 booked a loss even inside those 40 years of gains. The word missing from the chart is timeframe: buying property with money you may need back in two or three years is betting on the calendar, not on the market.
What to do with this information
Use the number for what it is good for: showing that, over a long horizon, real estate in the United States has historically been a good place to store value, and that the American market is measured and transparent enough for you to check that yourself. Do not use it as a forecast.
The useful question is not "will it appreciate?", but rather: can I comfortably afford this house in a scenario where it does not appreciate at all over the next five years? If the answer is yes, appreciation becomes a bonus. If it is no, it becomes a bet.
This text is informational and does not constitute investment advice. Past performance does not guarantee future results; confirm data and current rules before making any decision.
Sources and verification
- FHFA — House Price Index: repeat-sales methodology, national coverage and historical series (fhfa.gov/data/hpi).
- FHFA — House Price Index Quarterly Report 2025: annual appreciation around 2%, well below the pandemic peak.
- FHFA / Federal Reserve History — decline of more than 20% in the average price of homes between the 1st quarter of 2007 and the 2nd quarter of 2011.
- Bureau of Labor Statistics — Consumer Price Index (CPI-U): basis for the nominal-to-real adjustment over the 40-year period.
- California Association of REALTORS® (C.A.R.) — median for single-family homes in Orange County: US$1.49 million in June 2026 (confirm the most recent revision of the series).
- California Constitution, Article XIII A (Proposition 13, 1978) — property tax base fixed at the acquisition value.
Watch this part of the episode:
Historical analysis: six-fold appreciation over 40 years — starting at 3:02 · CADÊ BRAZIL
This article is a reference edition of episode 17 of the podcast and is subject to edits and editorial additions. For the full conversation, watch the episode. — Updated on 10/08/2026.